Last month I was conducting a series of Boardwalks with a large company in Australia. These people had an amazing array of kanban and other visual controls guiding their software development. Most important to me, they had achieved a culture not of continuous improvement, but deep curiosity and introspection. They were looking for any way to get their organization to communicate better internally and work more effectively. They were paying attention. It was beautiful.
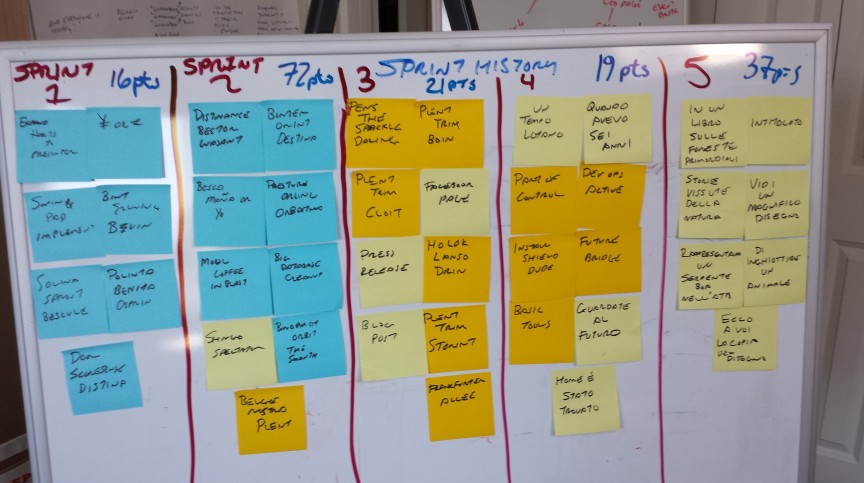
What stuck out, however, was one group in particular. This was a group of skilled coders and managers. I’d be happy to have any of them on one of my teams. They had a board that showed all their sprints, the story points for each sprint, and the user stories completed.
It looked like this.

Them: We have a problem and we can't figure out how to solve it.
Me: What is your problem?
Them: We can't get our velocity to stabilize. We get our work done, but the story points are all over the map. Sixteen, Seventy Two, Twenty One? What's wrong with us? Why can't we estimate?
Me: They sure are all over the place. Look at that.
Them: If we can't get our velocity to stabilize, we're never going to have meaningful estimates.
Me: Yep. Sure looks that way.
Them: Can you offer any advice?
Me: No.
Them ....
Me: What do you notice when you look at the board?
Them: Our velocity is all over the place.
Me: That's what you see when you look at this board.
Them: Yes. It's clear. Just look at the numbers.
Me: You're looking at the numbers.
Them: (confused) Do you have any tips on how to get them more uniform?
Me: You are aware you have no problem here and that your estimation is as close to perfect as its going to get, right?
Them: What?
Me: These features were in your sprint goals?
Them: Yes.
Me: You have a throughput of nine tickets. Make guarantees on six features each time and have three or four nice-to-haves. Then, at your first convenience, stop doing sprints.
Them: But the numbers!
Me: You've proven systematically and empirically that the numbers were bogus from the start. Focus on the work and not the ritual. These tickets are your real work. These numbers are your imagination. The bank can't run on your imagination.
Them: But some of those tickets were bigger than others. They aren't right sized.
Me: Apparently they are. Your work is uniform and unwavering.
Them: But the numbers....
Me: Are lies.
These developers had a beautifully proven and consistent throughput. They knew their release cadence perfectly. But they were focused on a faulty metric - they were looking at the proxy when they knew the reality.
We see here arbitrary story points numbers that have no value to anyone.
But we also see a very stable number of cards - 7,9,9,9,7. (This is honestly what this team had)
There is natural variation in these numbers. But the trend is clear and actually fairly free of real variation. We don't have enough experience to promise the full nine or even seven tickets, but six as a promise is of clearly low-risk. We aren't looking for a guarantee, we're looking for an honest estimate.
Understanding that there is a comfort level with six stories with a few other stories that are nice-to-haves changes their conversation with their product owner or customer from a "we think we can fit this much stuff we don't really understand in these two weeks" to "our history shows that we can reliably finish six features in two weeks, please give us six things and we'll get them done."
What is worrying is that these very smart people who already got most of this, did not see that their delivery was already stable and consistent. They were so focused on the proxy metric of velocity that they didn't see the real metric of completed work.
If you'd like to examine if your team is actually providing predictable value - I give this advice:
- Do what you are doing now.
- Set up a board like this that tracks story points and tickets.
- Watch both the number of tickets and your velocity.
- Track when work is actually started and completed. (cycle time)
- Track number of tickets per sprint. (crude deadline driven throughput)
When you've done this for five or six sprints. Look at the data.
The cards per sprint will give you some vital information:
- actual work completed every two weeks in number of features or stories
- an idea of the natural variation in work items produced every two weeks
- work type breakdown (bugs to planned features to unplanned features to emergencies)
You'll start to understand your work.
When that happens, you can do some real estimation. You can guarantee real results. And you can start to focus on what's really important: quality code, less escaped defects, and work that relates more closely to customer demands.
That number will give you the best rate at which your team can develop software under sprints.
